Thursday, September 14, 2017

Speeding up Min or Max ID’s on Partitioned Table

Speeding up Min or Max ID’s on Partitioned Table

Overview

A common scenario in using partitioned tables is to have a composite primary key where the first field (left side) is a unique id (the true PK), and an additional field defined to partition on.  There can be several reasons for this approach, but that is a different article.   Although explaining partitioning is beyond the scope of this article, it does need a quick overview of what it is, so this solution  makes sense.

When you are partitioning a table you are essentially creating separate data structures (B-trees) wrapped under a logical interface.  You can think of it as multiple identical tables in definition with different data, having a “union all” query defined in a view.  In fact before partitioning this was a common methodology to accomplish this task. 

Now that I rambled a bit you want to know why when using a partitioned table does grabbing the min and max of the primary key take sooooo long, and how do you fix it.  Theoretically you would expect SQL to perform the following steps in grabbing the Max Id
  1.         Grab the Max Id from each partition using a seek 
  2.         Hold the results in  temp storage
  3.         Get the Max ID from the  temp storage, and return that result.

However SQL doesn’t do that, it actually scans each partition and finds the max id after it has examined every record in each partition.  This is very inefficient, and could kill a query that depends on this value, as well as impact a busy server low on physical resources.    So what we need to do, is manually write the code to perform the steps that SQL Server should actually be doing. 

Example
Here I’ve created a table with 12 partitions defined on the Partfield. 


create table PartTable
(ID int  identity(1,1),
PartField int not null,
Fill char(50) default 'Hello',
insertdate datetime default getdate(),
CONSTRAINT [pkIDPartField] PRIMARY KEY CLUSTERED
(
       ID ASC, partfield
)WITH (PAD_INDEX = OFF, STATISTICS_NORECOMPUTE = OFF, IGNORE_DUP_KEY = OFF, ALLOW_ROW_LOCKS = ON, ALLOW_PAGE_LOCKS = ON)) ON testPS(PartField)


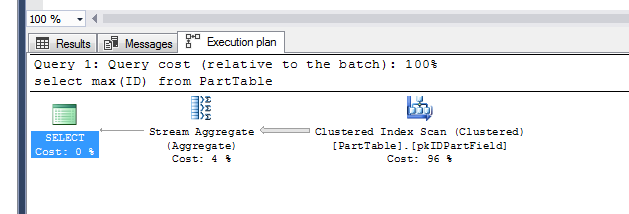
The goal is to get the Max ID on the ID field. 

select max(ID) from PartTable


If you look at the query plan for the above statement you’ll see its scanning each partition.  


Example


Step 1

Find the Partition numbers using the dmv sys.dm_db_partition_stats, and put the results into a temp table you can loop through to get the IDs. Notice in the predicate I have "in_row_data_page_count > 0", that's because often developers will have many partitions without data, for future use, 

select partition_number into #parts from  sys.dm_db_partition_stats
where object_name(object_id) = 'PartTable'
and in_row_data_page_count > 0

Step 2

Create a temp table which will hold the results from each partition


create table #ids (
 MinID bigint,
 MaxID bigint)


Step 3

Populate the 2nd table by looping through each partition using the first temp table you populated in step 1.  Here you use  “$Partition” in the where clause, which forces the query to do a seek, against each b-tree you query against.  Note you’ll need to know the name of the partition function that the field was defined on (testPartitionFunction).  


Declare @minPart int, @maxPart int
select @minpart = min(partition_number), @maxPart = max(partition_number) from #parts


While @minPart != @maxPart
Begin
insert into #ids
select min(ID), max(ID) from
Parttable
where $partition.testPartitionFunction(PartField) = @minPart
set @minPart = @minPart + 1
end

step 4

Select from the temp table

select min(minid), max(maxid) from #ids

Conclusion

This is pretty straight forward, sometimes you just need to manually code what SQL should be doing on the covers.  The key with working with partitions is understanding you're  working with separate data structures, and you need to write your code with that in mind.  


Stored Procedure Format


I like my code to be portable, so below is the same steps above put into a stored procedure that  can be used against any partitioned table with a similar structure.


Create Procedure GETMinMaxID_ON_Partition
@TableName varchar(100),
@IDColumnName varchar(100),
@PartitionColumnName varchar(100),
@PartitionFunctionName varchar(100)
as

Declare @InsertStmt  varchar(max)

--Get all populated Partition numbers into temp table
select partition_number into #parts from  sys.dm_db_partition_stats
where object_name(object_id) = @TableName
and in_row_data_page_count > 0


--Create table to store the min/max ids from all partitions
create table #ids (
 MinID bigint,
 MaxID bigint)


 --Set boundaries for your loop to query each partition
Declare @minPart int, @maxPart int
select @minpart = min(partition_number), @maxPart = max(partition_number) from #parts


--loop
While @minPart != @maxPart
Begin
--Insert into temp table max min values from each partition building and executing an adhoc statement for each partition value
Set @InsertStmt = 'insert into #ids select min(' +
@IDColumnName +
'), max(' +
@IDColumnName +
') from ' +
@TableName +
' where $partition.' +
@PartitionFunctionName +
'(' +
@PartitionColumnName +
') = ' + convert(varchar(10), @minPart)

exec(@InsertStmt)


set @minPart = @minPart + 1
end

--Return
select min(minid) as MinID, max(maxid) as MaxID from #ids


Wednesday, May 4, 2016

SQL Server Quickly Diagnosing Scans


Too often code gets released in production where the access path is a scan, as a DBA these are fairly easy to spot, without looking at a plan, but by simply looking at the amount of reads over a small amount of calls.  The key, no pun intended, or in this case the anti-pun is to watch reads slowly increase over time.  This is because if a query is scanning a table, it will do a consistent amount of reads, for example if a table has 100 data pages in it, then every call will show 100 reads, as data is inserted the table will grow to 101, 102, 103 data pages, and the amount of reads of your query will grow linear. The point is look for linear growth, if a query consistently stays at 15 reads, without growth, it’s using a btree index properly.  Let’s look at an example here.  Below I’ve setup a table so that each row is one datapage.  I’ve intentionally have not indexed FieldTwo, which we’ll query off of to force a scan.  I’ve also made FieldThree 8K, so each addition will add one read in the query

use AdventureWorks2012
go
create table TableOne
(FieldOne int identity(1,1) Primary key,
FieldTwo int,
FieldThree char(8000))

Declare @interval int
set @interval = 0
while @interval < 10000
Begin
insert into TableOne(FieldTwo, FieldThree)
Values (@interval, 'Hello')
set @interval = @interval + 1
end


If we run the following query, notice the amount of reads (10038) and that it uses a scan by examining the messages tab.
set statistics io on
go
select * from TableOne
where FieldTwo = 10

Table 'TableOne'. Scan count 1, logical reads 10038, physical reads 0, read-ahead reads 0, lob logical reads 0, lob physical reads 0, lob read-ahead reads 0.

The following query loops inserting 1 run, and running the same select query again looking at the messages you can see the linear growth.  I’ve pulled out a lot of the other information provided, so we can simply see the results of the select statement.

Declare @interval int
set @interval = 10001
while @interval < 10100
Begin               
insert into TableOne(FieldTwo, FieldThree)
Values (@interval, 'Hello')
Print 'Running Select Statement'
select * from TableOne
where FieldTwo = 10
set @interval = @interval + 1
end


Table 'TableOne'. Scan count 1, logical reads 10054, physical reads 0, read-ahead reads 0, lob logical reads 0, lob physical reads 0, lob read-ahead reads 0.

Table 'TableOne'. Scan count 1, logical reads 10055, physical reads 0, read-ahead reads 0, lob logical reads 0, lob physical reads 0, lob read-ahead reads 0.
Table 'TableOne'. Scan count 0, logical reads 8, physical reads 0, read-ahead reads 0, lob logical reads 0, lob physical reads 0, lob read-ahead reads 0.
Table 'TableOne'. Scan count 1, logical reads 10056, physical reads 0, read-ahead reads 0, lob logical reads 0, lob physical reads 0, lob read-ahead reads 0.


Table 'TableOne'. Scan count 1, logical reads 10057, physical reads 0, read-ahead reads 0, lob logical reads 0, lob physical reads 0, lob read-ahead reads 0.
Table 'TableOne'. Scan count 1, logical reads 10058, physical reads 0, read-ahead reads 0, lob logical reads 0, lob physical reads 0, lob read-ahead reads 0.

.

So let’s fix the query and put an index on this, so we can use a seek. 


create index aaa on tableone(fieldtwo)

select * from TableOne
where FieldTwo = 10

(1 row(s) affected)
Table 'TableOne'. Scan count 1, logical reads 5, physical reads 0, read-ahead reads 0, lob logical reads 0, lob physical reads 0, lob read-ahead reads 0.


Ok we now have our seek and have gotten the reads down to 5.  Great works as it should, but let see what happens as we add data by rerunning the query above, and see if reads change. 
Declare @interval int
set @interval = 20001
while @interval < 20100
Begin               
insert into TableOne(FieldTwo, FieldThree)
Values (@interval, 'Hello')
Print 'Running Select Statement'
select * from TableOne
where FieldTwo = 10
set @interval = @interval + 1
end


Running Select Statement

(1 row(s) affected)
Table 'TableOne'. Scan count 1, logical reads 5, physical reads 0, read-ahead reads 0, lob logical reads 0, lob physical reads 0, lob read-ahead reads 0.

If you go through all the messages you’ll notice it maintains 5 reads for every select statement, this is because it properly traverses the levels (2 in this case) of the index.  Note the messages still say scan but it’s not a true scan, it actually a range scan which is a good thing.


Wednesday, April 27, 2016

Finding Blocking in Mysql

I’m primarily a SQL Server guy, but I’ve been lucky enough to have a handful of MYSQL databases to manage, and outside of our NDB cluster, they’ve been designed very simple and therefore stable, so my interaction is limited.  As the company has grown we’ve acquired more companies based in MYSQL and although my team doesn’t manage these directly, we’re often brought in to help during crises modes.  Of course it’s not optimal to dust off your skillset during a crises mode, but a b-tree is a b-tree, and a nested loop, scan, and other fundamentals of a RMDB don't change from one system to another… mostly.  What is different are the tools at getting at the data.  In my latest experience I came across a DB riddled with locking, which of course was leading to blocking.  The problem was trying to find what calls were blocking what, and causing the issue.  Lucky the innodb engine has some great real-time tables for accessing intervals.  Below is a query I wrote to get a view of the blocking going on real-time.  I’m sure I’m not the first person to do something similar, but I just couldn’t find it. 


select T.trx_state as Blocking_trx_state,
T.trx_started as Blocking_trx_started,
T.trx_requested_lock_id as Blocking_trx_requested_lock_id,
T.trx_wait_started as Blocking_trx_wait_started,
T.trx_weight as Blocking_trx_weight,
T.trx_mysql_thread_id as Blocking_trx_mysql_thread_id,
T.trx_query as Blocking_trx_query,
T.trx_operation_state as Blocking_trx_operation_state,
T.trx_tables_in_use as Blocking_trx_tables_in_use,
T.trx_tables_locked as Blocking_trx_tables_locked,
T.trx_lock_structs as Blocking_trx_lock_structs,
T.trx_lock_memory_bytes as Blocking_trx_lock_memory_bytes,
T.trx_rows_locked as Blocking_trx_rows_locked,
T.trx_rows_modified as Blocking_trx_rows_modified,
T.trx_concurrency_tickets as Blocking_trx_concurrency_tickets,
T.trx_isolation_level as Blocking_trx_isolation_level,
T.trx_unique_checks as Blocking_trx_unique_checks,
T.trx_foreign_key_checks as Blocking_trx_foreign_key_checks,
T.trx_last_foreign_key_error as Blocking_trx_last_foreign_key_error,
T.trx_adaptive_hash_latched as Blocking_trx_adaptive_hash_latched,
T.trx_adaptive_hash_timeout as Blocking_trx_adaptive_hash_timeout,
T.trx_id as Blocking_trx_id,
Ta.trx_state as Blocked_trx_state,
Ta.trx_started as Blocked_trx_started,
Ta.trx_requested_lock_id as Blocked_trx_requested_lock_id,
Ta.trx_wait_started as Blocked_trx_wait_started,
Ta.trx_weight as Blocked_trx_weight,
Ta.trx_mysql_thread_id as Blocked_trx_mysql_thread_id,
Ta.trx_query as Blocked_trx_query,
Ta.trx_operation_state as Blocked_trx_operation_state,
Ta.trx_tables_in_use as Blocked_trx_tables_in_use,
Ta.trx_tables_locked as Blocked_trx_tables_locked,
Ta.trx_lock_structs as Blocked_trx_lock_structs,
Ta.trx_lock_memory_bytes as Blocked_trx_lock_memory_bytes,
Ta.trx_rows_locked as Blocked_trx_rows_locked,
Ta.trx_rows_modified as Blocked_trx_rows_modified,
Ta.trx_concurrency_tickets as Blocked_trx_concurrency_tickets,
Ta.trx_isolation_level as Blocked_trx_isolation_level,
Ta.trx_unique_checks as Blocked_trx_unique_checks,
Ta.trx_foreign_key_checks as Blocked_trx_foreign_key_checks,
Ta.trx_last_foreign_key_error as Blocked_trx_last_foreign_key_error,
Ta.trx_adaptive_hash_latched as Blocked_trx_adaptive_hash_latched,
Ta.trx_adaptive_hash_timeout as Blocked_trx_adaptive_hash_timeout,
Ta.trx_id as Blocked_trx_id               
from  Information_Schema.INNODB_LOCK_WAITS W INNER JOIN   
Information_Schema.INNODB_TRX T ON T.trx_id = W.blocking_trx_id 
inner join Information_Schema.INNODB_TRX Ta on Ta.trx_id = W.requesting_trx_id \G

Tuesday, April 26, 2016

SQL Server Index index intersection with the "OR" clause


The two most hated things a DBA hates is a request for a backup from three years ago, and coming across a query with an OR clause in it.  Actually that’s not true as DBA’s we’re just a grumpy group, but I don’t have a month to list out all my dislikes, so let me focus on the “OR” clause within a query.  Unfortunately many devs think that covering your predicates with a single index works, and on small data sets in test it does, but as the index grows the duration times grow linear since a scan is used in an OR clause if not indexed correctly.  This article will talk about how to index for an OR clause.  Rather than trying to verbally explain this through writing, I’ll go through with example. 
Below I’ve created a table, index, and populated enough data to make my point.
create table testtable
(FOne int, ftwo int, FillerField char(1000))

create index aaa on testtable (fone, ftwo)


Declare @interval int
set @interval = 1

while @interval < 10000
Begin
insert into testtable
values (@interval, @interval + 50000, 'Hello')
set @interval = @interval + 1
End

As you can see the table has a covering index on Fields Fone and Ftwo.  I created FillerField so there is enough data to make my point.  The covering index works great if there is an “AND” clause.  Note when I say covering, I’m talking about the predicates and not the entire query.


set statistics io on

select * from testtable where fone = 100 and ftwo = 50100


If we look at the IO’s in the messages (Why we use Set Statistics IO on) you’ll see it did 3 reads, using a seek with a Rid Lookup.  


The Seek is shown in the Query Plan above.  The Seek is used because FOne is unique and the predicate requires both Fone and FTwo meet the value so SQL simply needs to find all the values on the far left of the index its using, in this case aaa(fone, ftwo).  So it will look for where fOne = 100, once all the records with this value are found (acutally as they’re searched) it will examine the second value in FTwo, to see which ones match in this case  50100.


However using “AND” differs from the “OR” clause.   it doesn’t work this way, it needs to find all the data from both fields that match fone or data matching ftwo.  So if we change the query to an “OR” clause it will move from a seek to a scan.


select * from testtable where fone = 100 or ftwo = 50100 


The reads have gone from 3 to 31.  Here the predicates are covered but since it can be either or it can’t do a seek it has to examine each row and column.  In fact in many situations SQL might find it cheaper to scan the underlying table in this case a RID. 

In order to get this efficient, and remove the scan, we need to do a seek against each field in the OR clause,  and leverage an intersection index lookup.   By adding the below index, in addition to the one already created you’ll see each field now has a seek, and the results are concatenated into temporary storage where dupes thrown out.  Once this distinct intermediate data is determined, it is used to lookup against the RID.


create index bbb on testtable(ftwo)


select * from testtable where fone = 100 or ftwo = 50100


The following example mimics something I recently saw in a production, the question is how something like this gets out into the wild. Usually this is a result of two circumstances.  First most testing is functional testing, and the difference in few milliseconds isn’t noticeable.  The second is even if you’re testing performance the index scan against a small set doesn’t stand out, and because it is covered the scan itself is small, its only noticeable after the dataset grows, or the volume of calls increase that it becomes noticeable.